

Advance Block
The advance block candle is supposed to act as a bearish reversal but testing shows it is really a bullish continuation pattern.
Tested performance: Bullish continuation 64% of the time.
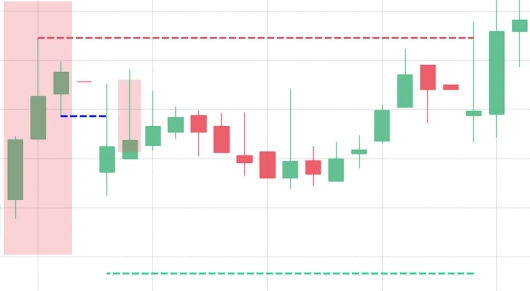
The advance block candlestick pattern is a 3-bar bearish reversal pattern.
- It has three long green candles with consecutively higher closes than the previous candles.
- Each candle has a shorter body than the previous one.
- Theoretical performance: Bearish reversal
Advance Block is a bearish reversal pattern. This is similar to Bullish Three White Soldiers Pattern. It is characterized by three long white candles with consecutively higher closes. Each successive day is weaker than the one preceding it, which suggests that the rally is losing strength and there is possibility of a reversal in trend. This pattern appears after a clear uptrend. This pattern can be used by the traders as an early sign to lock in profits or move up the protective stop loss levels.
The advance block and stalled pattern are both candlestick chart patterns that suggest an upward trend is slowing down. Candlestick chart pattern explained with video and charting examples.
The advance block candlestick pattern presented by finvids.com finance videos. First day is a large bullish real bodied candlestick, the second day opens near the close of the first day and is a smaller bullish real body, notice the tall upper shadow. The third day opens even higher near the close of the second day but it is even smaller bullish real body and has a large upper shadow as well.
Notice that as time progresses the real bodies get smaller over time and also there are tall upper shadows on the second and third day. The advance block pattern is not considered a reversal pattern rather technicians like Steve Neeson suggest selling out long's but not necessarily going short usually a period of consolidation is expected after this pattern.
The psychology of this pattern is as follows: the large bullish candlesticks show that the Bulls are in control, each day the Bulls continue to be in control but they aren't as powerful thus the smaller real body also the tall upper shadows show areas where Bulls are pushing higher but bears are able to reject them. This develops an area of resistance to future price rises.
The following chart is a chart of the nasdaq-100 ETF that shows an advanced block candlestick pattern. First of all there is a large real body I'll buy a medium real body notice the tall upper shadow where the Bulls are being rejected by the Bears as they try to make new highs and then the following is a small real bodied almost like a doji.
Resistance is is being created after that the market heads further downward stall pattern. The first day is a large bullish real body, second day is another large bullish real body that opens near the close of the first day, the third day is a small spinning top or like a doji this as well as the advanced block pattern suggests an area of consolidation rather than reversal so the Bulls are in control by the two large real bodied bullish candlesticks but then a very small bodied candlestick appears almost like a doji which suggests that there's indecision that the Bulls are unable to make higher highs.
This chart is of the nasdaq-100 as well we have a large bullish real body followed by another bullish real body but then a small real body that suggests that bulls are unable to push higher and that results in a downtrend. For more details make sure that you go to finvids.com and view in greater detail the advanced block and stalled pattern.
To summarize, the advanced block pattern occurs when you have a day 1 candlestick that is a large real body followed by a smaller real body and the third day is an even smaller real body. The main idea is that the tall upper shadows are acting as future resistance and suggests an end of the up trade. The stall pattern is very similar in that the too bullish bodies are followed by a small real body or a doji suggesting hesitation and an end of the uptrend.