

Bearish Doji Star
The trend is continued if confirmation on the third day is present which could come from a black candle with a downward gap or a lower closing price.
Theoretical performance: Bearish reversal
Tested performance: Bullish continuation 69% of the time
The white candle is followed by a short candle, a Spinning Top, a Highwave, or a Doji with a gap in the trend’s direction.
The first day strengthens the current ascending trend. The trading starts with an upward gap on the next day, but the trading range remains narrow and a Doji is formed. The Doji reflects the uncertainty of the market participants and the trend seems to come to a halt. The third day can confirm the reversal, if the share opens lower and closes near the daily minimum.
The Bearish doji star is a bearish reversal pattern represented by two candles during an uptrend. The first candle is increasing and has a long body it is followed by a Duchy that opens and closes above the previous candle.
Our indecision patterns and represent how poles and beers fight to determine the future direction of the price this pattern represents how inept rain fades out and leads to be bearish reversal.
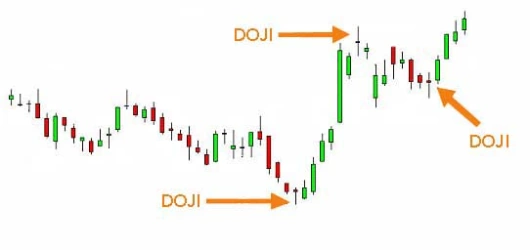
The doji at the end of the uptrend reflects how the Brewers have suddenly appeared to stop the trend and very likely push the price down since the pattern usually precedes to false in the price it will signal myself every time that is appears in the chart.