

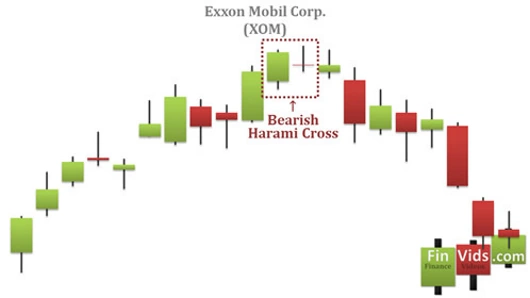
Bearish Harami Cross
The bearish harami cross shows a doji candlestick on the second day whose trading range fits inside the prior day.
Theoretical performance: Bearish reversal
Tested performance: Bullish continuation 57% of the time
Look for a tall white candle in an upward price trend. The next day, a doji appears that is inside (including the shadows) the trading range of the white candle.
Important:
During the time in a bull market, price breaks out upward the day after the doji, continuing the upward trend. That happens 57% of the time.
A bearish pattern shows a potential future downward trend. It occurs after an upward trend with a long upward candle meaning the buyers are in control. The upward candle is then followed by a doji which, similarly to before, must be within the previous candleÔÇÖs length. It represents indecision from the buyers and potential change of momentum because the doji ÔÇťgapsÔÇŁ open closer to the mid-range of the previous candle.
Our Harami Cross is a japanese candlestick pattern that consists of a large candlestick that moves in the direction of the trend followed by a small dodgy candlestick. The dodgy is completely contained within the prior candlesticks body so the harami cross pattern suggests that the previous trend may be about to reverse. The pattern can be either bullish or bearish, in our case here it's a bearish pattern.
The bullish pattern signals a possible price reversal to the upside while the bearish pattern signals a possible price reversal to the downside so the bullish harami course is confirmed by a price move higher follow the pattern for a bearish hierarchy cross. Some traders prefer waiting for the price to move lower following the pattern before acting on it.
In addition, the pattern may be more significant if occur near a major resistance level. Other technical indicators such as rsi moving lower from our overbought tertiary may help confirm the bearish price movement. Harami Cross pattern do not have a profit target therefore traders need to use some other methods of determining when to exist a profitable trade.
Some options include using a trailing stop loss finding an exit with fibonacci extensions or retracement or using a risk reward ratio.