

Bearish Harami
The bearish harami is supposed to act as a bearish reversal, but testing shows that it is a bullish continuation pattern 53% of the time.
Theoretical performance: Bearish reversal
Tested performance: Bullish continuation 53% of the time
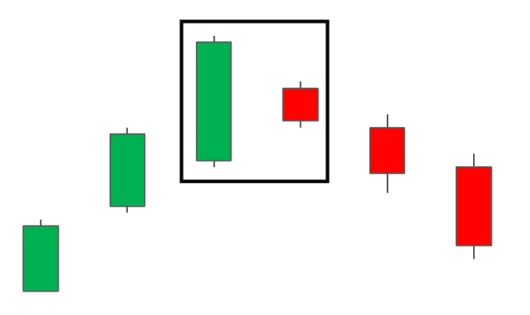
The Bearish Harami pattern is a reversal pattern appearing at the top of an uptrend. It consists of a bullish candle with a large body, followed by a bearish candle with a small body enclosed within the body of the prior candle. As a sign of changing momentum, the small bearish candle ‘gaps’ down to open near the mid-range of the previous candle.
Bearish Harami Checklist:
Identify existing uptrend.
Look for signals that momentum is slowing/reversing (stochastic oscillators, bearish moving average crossover, or subsequent bearish candle formations).
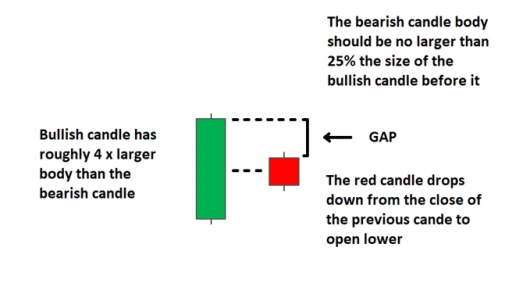
Ensure that the body of the small red candle measures no more that 25% of the previous bullish candle. Stocks will gap down, showing the red candle mid-way down the previous candle. The gap is likely not found in forex candlesticks as they will mostly open at the same level as the prior candle’s close or very close to it.
Observe that the entire bearish candle is enclosed within the length of the previous bullish candle’s body.
Look for confluence with the use of supporting indicators, key levels of resistance or other supporting evidence to support the trade.
Look for a tall white candle followed by a small black one. The opening and closing prices must be within the body of the white candle. Ignore the shadows. Either the tops of the bodies or the bottoms (or both) must be a different price.
The first day of this pattern is a large bullish candlestick, the second day is a small bearish candlestick. Notice that the second day small bearish candlestick real body is within the real body of the first day's candle. The bearish harami cross occurs the first day is a large bullish real body but the second day is a small real body or a doji. The bearish harami pattern should occur after an uptrend and suggests a future downtrend, however Nissan suggests that the harami pattern is not as significant a reversal pattern as the engulfing pattern.
Psychology of this pattern is as follows, the large bullish candlestick after an uptrend shows up the Bulls are continually in control. However, the following day is a gap down which is bearish in and of itself and then the candle itself is also bearish so whereas before the uptrend was intact. Now there is questions as to whether the trend will continue higher using blended candle analysis where you combined two or more candles into one candlestick. The bearish harami pattern equates to a shooting star pattern.
The harami pattern can suggest and time of consolidation and new resistance after an uptrend, so we see we have an uptrend and we have a bearish Romney pattern, that establishes an area of resistance, prices fluctuate, test that resistance and then go downward. This chart of ExxonMobil illustrates a harami cross so we have the bullish candlestick followed by a doji. A doji is a sign of indecision so after a uptrend when you see a doji suggest that prices could be consolidating or falling downward, in this case they fall downward.
For more details and in that discussion of the bearish Romney pattern please see the content below the video at fin vids com there are three important traits that increase harami's importance as well as other detailed information. In summary the bearish Romney occurs when the first day is a large bullish candlestick that continues the previous uptrend, the second day is a small real body candlestick that is within the body of the first day. The difference between a bearish Romney and a bearish Romney cross is that the second day the harami cross is a doji. The bearish Romney is a potential top reversal pattern that can act as a future resistance, however it is not considered as strong as a bearish engulfing pattern and again more detailed information explanations and chart examples are shown at finvids.com