

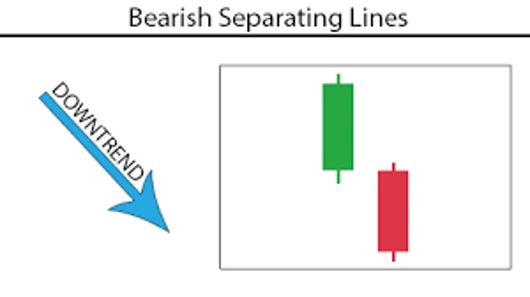
Bearish Separating Lines
Those who have experience with the bearish separating lines candlestick pattern know that it is a very unreliable indicator.
Theoretical performance: Bearish continuation
Tested performance: Bearish continuation 63% of the time
Look for a tall white candle in a downward price trend followed by a tall black candle. The opening price of the two candles should be similar.
The breakout from this bearish separating lines is downward when price closes below the bottom of the two-day candle. Since price enters from the top trending down and breaks out downward, this candlestick is a continuation pattern. It continues the downtrend already underway.
The bearish separating lines candlestick pattern is easy to distinguish once you know its characteristics. First, there should be a marked downward trend in prices. On the first day of this pattern, you will see a white candlestick. The second day will open at or near the first day’s opening price, but the candlestick will have a black body with no upper shadow. Many people will recognize this as the black opening Marubozu candlestick.
This video focuses on a daily chart where in each candlestick details a single day's trading. This is most important for online trading.
Let's start. Bearish separating lines Irish separating lines consists of two candles. The first day's white candle is followed by a black opening marubozu with its opening price close to the previous day's closing price.
How to identify, one...first day is a long white day, two...second day is a red day that opens at the opening price of the first day.
Psychology, the long white day produces skepticism in the bear market, the next day the long red day that forms eases concerns by the shorts. The downtrend should resume.