

Bullish Breakaway
The Bullish Breakaway pattern is a five candle reversal formation that occurs during a downtrend.
Theoretical performance: Bullish reversal
Tested performance: Bullish reversal 59% of the time
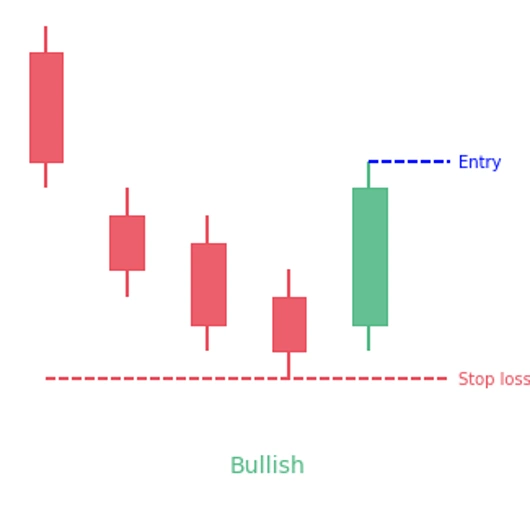
Look for a series of five candles in a downtrend. The first candle is tall and black followed by another black one that opens lower, leaving a gap between the two bodies (but shadows can overlap). The third day is a candle of any color but it should have a lower close. Day four is a black candle with a lower close. The final day is a tall white candle that closes within the body gap of the first two candles.
As said, the bullish breakaway is a bullish reversal pattern that typically forms at the end of a bearish trend or price swing.
Here is how to identify the pattern:
The first candle is long and bearish
The second candle should preferably perform a negative gap, and then develop into a negative candle
The third and fourth candles should be bearish. However, it’s acceptable if the third candle is bullish as well.
The fifth and last candle is a big bullish candle that breaks out above the high of the previous three candles. It’s extra positive if it opens with a positive gap.
In this tutorial about bullish breakaway candlestick patterns this video focuses on a daily chart where in each candlestick details a single day's trading. This is most important for online trading.
Let's start, bullish break away, this 5 candlestick pattern starts with a strong black candlestick, the next three days after the downside gap set consecutively lower prices. However, the last day completely erases the limited losses of down days and closes inside the gap between the first and second days.
This suggests a short-term reversal. How to identify, one...first day is a long red day, two...second day is a red day whose body gaps down, three...third and fourth days close lower each day, four...fifth day is a long white day that closes inside the gap created by the first and second days.
Psychology, the downtrend is accelerated by a gap down, the next few days trend down however start to run out of steam.
The last day of the pattern shows a breakout and close above the previous three days, however the gap created on the first day remains unfilled. Since the gap is not filled in, the trend is obviously deteriorating this implies the reversal signal.