

Bullish Doji Star
A bullish star doji occurs after a decline and looks like a plus sign but acts as a continuation of the existing price trend 64% of the time.
Theoretical performance: Bullish reversal
Tested performance: Bearish continuation 64% of the time
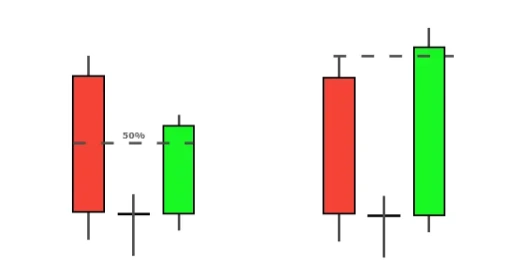
Look for a tall black candle on the first day followed by a doji (where the opening and closing prices are within pennies of each other) that gaps below the prior candle's body. The shadows can overlap, but the doji's shadows should not be unusually long, whatever that means.
To make sure the trend is continued, a confirmation on the third day is needed. The confirmation could come from a white candle with an upward gap or a higher closing price.
In this very short video I will talk about the bullish doji star which means that it's a bullish reversal pattern which means that we have a downtrend here and by definition, in theory this pattern should reverse the downtrend into an uptrend so the pattern is as we can see build of two candles.
The first condition is of course that it has to appear in a downtrend so we see the downtrend here and then the pattern appears the first candle of that pattern it's a black candle which means that, the opening price is here and the day closes here if it's a daily chart but additional condition is that it has to be a significantly long candle which means that for example in this particular algorithm we use behind this software is that at least if we take 10 previous candles the body of this black candle has to be at least 70 percent of the average body length in the 10 previous days, and if we have such black candle and the day opens even lower than that the previous day, so it's a gap here, the closing day was here and then it opened here and during that day nothing really happens.
I mean the day opens at the same level at which it closes or near the same level because we may allow a very small deviation from this so if it's so small difference between the open and close that still on the on the chart we would see a doji candle and the classical doji is meaning that open prices on is on the same level as the closing price then it means that something bad happens that indeed there was a trend which is going down there was a strong bearish candle here, big data fall I mean a price fall on that day but on the following day the birds were not able to push the prices even further so by definition this candlestick pattern is forecasting reversal so that it forecasts that this trend will end and we will have a chance to have a bullish trend the option.This is just a theory because of course and the story behind it you can put any kind of story you would like what is really important is to quantify it to measure how really such pattern works in reality and to be objective in that measurement meaning. That it's not that we will look on the chart with a naked eye and will try to identify a bullish doji start a candlestick patterns but will try to apply an algorithm which an objective way will find all occurrences of such pattern on the chart and based on that we'll try to see if we can come up with some conclusion if indeed this pattern works as expected and in order to answer this question we are using a huge data set of the S&P 500 going back to 1950 so almost 70 years of data but not only the char we will not only look on the charts which of the stocks which are now in S&P 500 but also we will look into the stocks which are not listed anymore in the in the index SNP 500 which is very important because it happens that the companies they rise and they collapse and they are removed from the index and the new stocks are added to the index and therefore we will see into all stocks in the S&P 500 and in fact it's not S&P 500 but as we can see we had almost 1,800 stocks during the 70 years period of the of the history of the S&P 500 index which means and this is the most important as it's a daily daily data we have to scan over 13 million candles that's a quite huge data set and based on such an huge data set we can say what happens with that bullish doji star candlestick pattern.
So let's see first of all during 70 years of data on S&P 500 we found over 27,000 occurrences of such pattern which is quite a lot because although it's not the most frequently appearing candlestick pattern on the chart mainly because of that second candle which is a doji which is not very typical especially on the liquid stocks but still we were able to find over 27,000 or occurrences of bullish doji star and how it worked so in order to answer this question we'll see how a market behaved in 10 following days since the pattern appeared and we have here at certain levels of let's say as we call it efficiency and the highest level of efficiency means that after within 10 days since the pattern appeared the price went up because it's a bullish pattern at least by 3.5% so in 44% of the time all of these occurrences of the pattern indeed in the 10 following days since the pattern appeared the price is moved higher by at least 3.5% on the other hand on the other hand in almost 20% of the time so let's say that one on the 5 appearances of the pattern nothing really happened as expected meaning that the price were not going higher than zero point zero point three percent which means that in fact the price we was not going up so we can call it as a false signal but if we will exclude that we can see that we still have a low efficiency and that we have a medium efficiency which means that the price in 80% of the time went up at least 0.3 percent up to 2 percent this is the low efficiency or in almost 15 percent of the time the price went up at least by 2 percent but no more than 3.5 so it means that indeed there is something behind this pattern of course the pattern as such is the strategy so it's just only it's just only a simple trigger which could be used to build a strategy but of course there's more behind the strategy you have to have the position sizing you have to know how to build a portfolio how correlated you have positions in your portfolio and so on and so forth but the patterns are such as they are repeatable and you can objectively find them on the chance as for example using candlescanner software it can be used to build your edge on the market let's see now.
Also, how the pattern really some real live example can appear on the chart and we can see here the Microsoft Stock Exchange Microsoft company on the S&P 500 index and we can see this line here which is just used to show us the trend and we can see that there is a small downtrend here and indeed here is a doji star so we have a black candle here then we have a doji candle here and indeed the following days the prices were going higher of course as I said it doesn't mean that it happens always and as I said just to repeat on over 40 or exactly 44 percent of the time the price went up by at least 3.5% after the patterns occurrence.
Okay, that's all for my side thank you very much for your time if you would like to play a bit with your own data or with your own market just I encourage you to go on our website at candiland.com and download candlescanner and give it a try I hope you'd like the video and happy trading.