

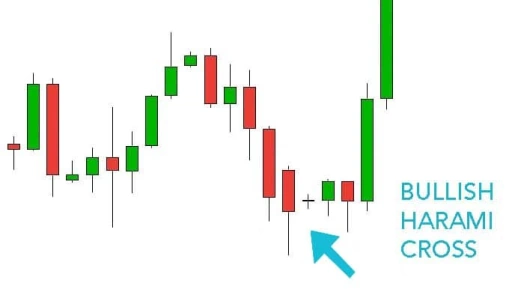
Bullish Harami Cross
It is supposed to act as a bullish reversal of the downward price trend but price continues falling 55% of the time.
Theoretical performance: Bullish reversal
Tested performance: Bearish continuation 55% of the time
Look for a two candle pattern in a downward price trend. The first line is a tall black candle followed by a doji that fits within the high-low price range of the prior day.
The Bullish Harami Cross is a two-line bullish reversal pattern. The first candle engulfs the second one, being a doji candle, including shadows.
The Bullish Harami Cross appears in a downtrend and predicts its reversal. The pattern should be confirmed on the nearest following candles. A doji candle appearing as the second line indicates the market indecision. Interestingly, in order to recognize the pattern as valid, its first line needs to be a long black candle, which may become an important resistance zone.
For this reason, the one should be careful when such pattern is formed on the chart.
I want to bring you all an update on something I was studying today and what we're gonna be looking at here is Japanese candlestick charting techniques and what this one is is the bullish harami cross and guys, what you're seeing here number one with this bullish harami cross this is what I want you to think of this as hurrah me or hear me whichever way you'd like to say it in Japanese means pregnant woman, so what you're doing is looking at this right here this long body that is the mother body and this is the child here. So what you have here is a bullish harami cross.
This is actually more powerful than a traditional her ami which a her ami pattern here guys a normal one you'd have basically a body about this size right here in this place where you have the doji, but with this dozy that it makes it even that much more powerful that you may have that reversal. So what we're looking for here is a reversal pattern and that's that her ami that we're looking at here that bullish harami cross and what we're gonna be doing here we're gonna be reading out in my book it's called Candlestick charting explain timeless techniques for trading stocks and futures is by Gregory L Morris and we're gonna go into the actual commentary and the rules of recognition for this Candlestick charting pattern, so if you see this guy's and you're looking at it a lot of the times this will be that reversal that you're looking for so we're gonna dig into this it says commentary the her ami pattern consists of a long body followed by a shorter body it is the relative size of these two bodies that make the Harami important.
Remember that though she days where the open in the close price are equal represent days of indecision, therefore small body days that occur after long body days can also represent the day of indecision. The more the indecision and uncertainty the more likely of a trend change when the body of the second day becomes a doji, the pattern is referred to as a harami cross with the cross being the doji the harami cross is a better reversal pattern than the regular harami, so guys what we're trying to do is put ourselves in position, position to where if we see something like this and then we have the next day follow through and a higher close up here a lot of times that's the time to jump in that's your confirmation so we can ride it to the to the upside because the trend changing and that's what we're looking for here guys and that's why I'm bringing these videos to you so that we can start spotting these things together and even down in the comments when I'm doing a light coin video or whatever you can say hey you know look I saw a bullish Romney cross that I may have missed but you know about it because you were watching these videos and really studying and learning I'm so proud of all the people who were studying and learning this type of stuff and enjoying this.
And guys, if you like this like subscribe hit that note of case bail I appreciate we're trying for 100 likes on these tutorials can't do it without you. So we'll dig back into this now the three rules of recognition for this to be valid, number one a long day occurs within a trending market so this trend is down and here's your long day right here guys number two, the second day is a doji the opening the clothes are virtually equal so right here that's that opening that closed completely equal right there so we have that doji candle and then three, the second day doji is within the range of the previous long day so that's like we talked about that baby so this is the mother candle and then this is the child right there that's what you're looking for and you can see how it's within that body it's not down here within the wicks so really keep that in mind that's an important part of it guys.
Now, the scenarios in psychology behind this pattern and why this happens, the psychology behind the hurom e cross starts out the same as that for the basic herati pattern a trend has been in place when all of a sudden the market gyrates throughout a day without exceeding the body range of the previous day what's worse the market closes at the same price as it opened volume of this doji day also dries up reflecting the complete lack of decision of traders a significant reversal or trend has now occurred. Pattern flexibility the color of the long day should reflect the trend so this red candle this is reflecting this downtrend so that's that's key number one we got that. The doji can have an open and the close price that are within two to three percent of each other if and only if there are not many doji days in the proceeding data so you don't want to have a bunch of doji's down in here guys it's not going to mean as much as if you're coming out of a downtrend and then you hit one that looks like that and then you start moving to the upside even more that.
Next thing it says the pattern breakdown and guys this is the bullish Romney this can also be a top pattern as well just so you know there's a bearish forearm across which I'll do in a separate video this one I just want to focus on the bullish but my my book says here the bullish and bearish harami cross is reduced to a single lines that support their interpretation in most instances the body of the single day reduction can be considered really longer than what is allowed for a paper on burello or Hamill hammer line candle the fact that the breakdown is not contrary to the pattern is supportive and then the related patterns the Harambee cross could possibly be the beginning of a rising or a falling 3 method depending on the next few days price action the rising and falling three methods patterns are continuation patterns which are in conflict with the signal given by the haram e cross.
So guys, what we're trying to do here is basically just spot things like this and if we pick this out it's like almost reading music in a way if we can pick these things out and we see confirmation the next day and say that was on good volume that would be a good time to jump in because most likely the trend is jeanna gonna change just like up here do you see how we're in this uptrend so we were moving up and then this candle here we had a bearish engulfing candle which which showed us that we would probably be getting pushed to the downside and that's exactly what we saw right here.
So guys, it's really important to learn these things and study these things because the more that we learn the the greater advantage we're gonna have what we're trying to do we're not market makers we're trying to ride the coattails of the market makers so if we can get a jump on these things and we see a bearish engulfing candle like that and we said hey we better get out of there we see a bearish engulfing candle we're getting some confirmation you can really save yourself you know all this percentage and loss and just like this if you can pick up this little three pattern here this is a two candlestick pattern but I'm just saying with that continuation you can make money the the people who are successful are the people who can pick out the trend changes the fastest that's what people are paid the big money for.
So guys we're gonna try to do our best here if you like these tutorials like subscribe hit that notification bell I appreciate you being here with me and I'll just keep doing these and if you haven't seen any of the other ones go into the playlist and I got a bunch of tutorials in there I really hope you guys will study them and learn some stuff and all this is just out books guys encyclopedia chart pattern all these candlesticks books I'm just trying to give you the best information I can so really put it to use guys and uh do the best you can god bless you all.