

Bullish Harami
The bullish harami candlestick functions almost randomly with reversals taking a slight edge over continuations by 53% to 47%.
Theoretical performance: Bullish reversal
Tested performance: Bullish reversal 53% of the time
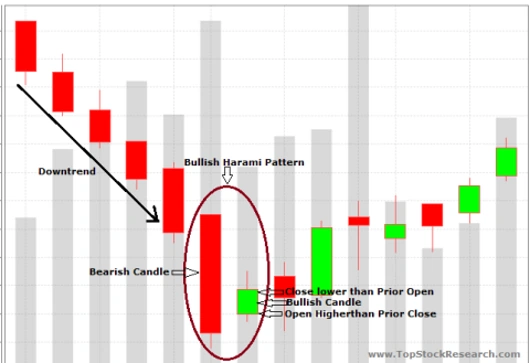
Look for a tall black candle in a downward price trend. The next day a white candle should be nestled within the body of the prior candle. Ignore the shadows. The tops or bottoms of the bodies can be the same price, but not both.
The Bullish Harami candle pattern is a reversal pattern appearing at the bottom of a downtrend. It consists of a bearish candle with a large body, followed by a bullish candle with a small body enclosed within the body of the prior candle. As a sign of changing momentum, the small bullish candle ÔÇśgapsÔÇÖ up to open near the mid-range of the previous candle.