

Bullish Kicking
Pattern is composed of two marubozu candlesticks: a black one as the first candle followed by a white one with an upward gap between.
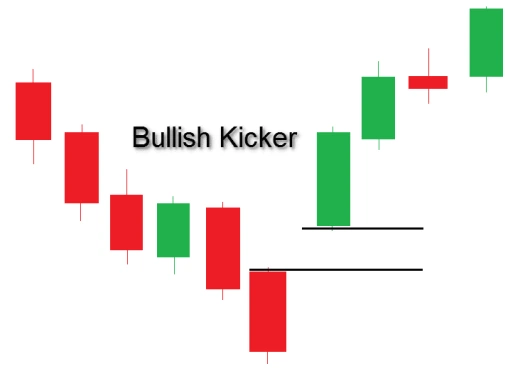
Theoretical performance: Bullish reversal
Tested performance: Bullish reversal 53% of the time
Look for a tall black marubozu candle followed by an upward gap then a tall white marubozu candle.
Construction:
First candle
a Black Marubozu appears on as a long line
Second candle
a White Marubozu price gaps upward appears on as a long line
Hey everybody this is Ryan Mallory with the Internet's best swing trading service share planner calm and today I'm going to be talking to you about the bullish kicking pattern and the bearish kicking pattern so the nickname forum is it like bullish kicker or bearish Kirikou that's tends to be what I go by and for this this YouTube video I'm going to be calling them kickers and and and whatnot so any case let's go ahead and dig right into it here what I want to do just lay down a foundation for you and we'll get to the charts in just a little bit but I want to just describe to you what it is more from a textbook standpoint.
Now, on a bullish kicker you're going to have you know one big ugly red candle going down, okay this is also a filled-in body so we'll just scribble it in there for a little bit and then the following day all right following day we're gonna have this big green candle that gaps above the previous day's candle body and it runs higher so what you have here is you have a down day right and then the next day you have this huge green body to the upside and it's usually like a reversal type of pattern so where I like to see this out a lot of times is it like at the bottom of a sell-off so this is usually a good sign that perhaps a very strong emotional bottom has formed because it's essentially negated an entire candle pattern right at the open from the previous day now your bearish kicker is going to be very similar to the bullish kicker except for the fact that it's the exact opposite so we'll draw this candle here alright so a full body candle it starts starts at the bottom and closes at the top and then the next day you get the gap down below the opening price of the previous day and we just fill it right in like that and opens up at the top and closes at the bottom and so just like we said opens higher the previous day finishes even higher following day gaps below the previous day's opening price and sells off the rest of the day.
Now this is the textbook form right but this can take many versions of it and when you read the textbook version it will try to tell you that it has to open at the Loews of the day and it has to close at the highs of the day and then theory that's correct but in practice it's always much different you're always going to have some shadows on these things they're never quite perfect you might have something like that and something like so or like that and like that and here and here so you can have some shadows on the chart and that's not a bad thing and if anybody tells you differently they're living in the ivory tower and they're not really applying technical analysis to real-life circumstances so this is what it looks like in theory obviously there's some give-and-take I would even say that sometimes you can have a bearish kicker pattern where it gaps up one day and then the following day you get a gap lower but it doesn't quite be the opening price from the previous day but it's still a pretty notable price should we just completely toss this out and ignore it as if it never even happened no I don't think you should I mean is this right here a textbook bearish kicker pattern no but in practice it should be treated as such so there's it there is a difference between what you see in theory and how it relates to everything in the technical analysis world and practice and that's what you've got to make sure that you don't do is is is essentially try to trade according to in a textbook fashion that doesn't realize that in the real world and the real world of trading it is all very much different there's a little bit of a messiness to it and you have to account for that.
So now you should have a good idea of what a bullish kicker and a bearish kicker pattern is and how they operate just from more of like the theoretical standpoint
Now let's go ahead and dig into the charts and see exactly what I'm talking about in real life so the first one we have here is Lowe's company this is a pretty recent one but when you zoom in you can see it had this gap up and then there's just massive selloff thereafter and it Creed this big time red bar candle pattern and just like theory versus practice you do have a little bit of a shadow there so it's not opening at the highs of the day and selling off there after it's actually opening and going up a little bit and then spending the rest of the time selling off but the next day you have this huge monster gap higher to where it eclipses the previous highs and opens up and just takes off thereafter this to me is like one of the best examples of a bullish kicker pattern that you'll have.
Now it doesn't happen at the end of a huge sell-off I mean technically you can say it was basing at the end of a pretty significant sell-off going back to the January highs but it was stuck in consolidation but this is also a area that I actually do like to see the bullish kicker pattern come out of his is a consolidation pattern where the actual strong green bar higher pushes it out of that consolidation and that's what you have here it's a pretty promising setup and then what you should start seeing in the days ahead you should start seeing more gains pile on now this one's early in the development but you can see that it has had a few good days since that bullish kicker pattern confirmed let's go ahead and go to my next chart here o LED and what you have here is a huge sell-off back down to the 20-day moving average it's a big strong red candle bar but then the following day it actually gaps higher you can see it gaps above the opening price from the previous day and just really starts to take off I mean makes a huge profit for the traders who had bought off for that 20-day moving average and what's cool about this as well you do have some some gains that follow in the days ahead and makes for a really great trade there so this was a big time opportunity there you know when you when you trade these you're not necessarily looking to get in at the at the first candle here that's not really the premise behind the trade you're really trying to get in on the gap up and then when it starts to rally thereafter you can get in towards the end of the day or in the following day but usually there's some there's some good profits that can be made and then for the last example let's go ahead and look at Nvidia and this we'll take us back to April of 2017 so you can look at it on your own charts if you want to and here this is what we were talking about having it happen at the end of a reversal or at the end of a sell-off and then the subsequent reversal hitting that slows and then you have a not really a gap higher on this and one actually it goes a little bit below the opening price and then shoots higher but that's what I'm talking about and that's what a lot of people really have a hard time getting their mind around is that the stock market doesn't follow textbook theory you have to kind of look at what is the spirit of what it's trying to say what is the candle is really trying to tell you that it's a reversal taking place here and so you have the reversal it's it's moves higher and it's probably compared to the two other examples which were near textbook examples this one provided a the best the best reversal yet I mean you have a multi-day six seven day rally it consolidates some and then it just keeps going higher and higher and higher I mean this was this was your telltale sign here to get long on NVIDIA I mean look where it goes from there on out I mean it just never stops so this kicker pattern created the reversal that allow NVIDIA to go from like a ninety five dollar stock all the way up into the 150s within a matter of a few months.
Now the next pattern is the bearish kicker pattern and the first one's going to be TR V we'll go ahead and move on to current day this actually happened the day that I filmed this area and what you have is some consolidation it's kind of at the highs of a recent sell-off it bounced back you could say it's trying to form a bear flag however you have a rally higher the day before it doesn't close at the highs but it doesn't have to in order for it to be a bearish kicker people will disagree with me on that and that's fine but the possibility of ever finding a bearish kicker pattern that matches the textbook is like slim to none it just doesn't really happen so rally higher and then the following day which is today it gaps below the previous day's opening price and then sells off thereafter so my guess here with the Travelers company trv is that we're going to see further downside on the days ahead and what makes this one so much more interesting is the the strong volume that the sell-off takes place on so keep an eye on that one my next example is going to be Facebook now this is a little bit different one you might not spot it initially but it is a qualified bearish kicker pattern and this happened back in March of 2018 and there were some news that happened with it - with the camber Channel it ACCA's scandal and it gaps higher and then the following day some news came out and it gaps way lower I mean much lower and has a subsequent sell-off that lasts the rest of the day now would that be a good time to get short once you get the confirmed bearish kicker well in this case for sure in most cases yes that is true and as a result Facebook has a significant sell-off for many days to come taking it from where it closed at around 172 all the way down to like a 150 area so really an incredible bearish kickers trade setup there and then finally we have Tesla and this one's gonna go back from October of 2017 and here you have it where it's starting to break out and it actually gives you a nasty head fake said the breakout and then the gap below the previous day's opening price and once again you do have some shadow is there but almost every one of your bearish or bullish kicker patterns are going to have shadows you just can't find them without it most of the time you're asking for two days where that doesn't happen and it just you don't find those so rally higher and then the following day gaps below the previous day's opening price and sells off and now look what it does it goes from a closing price of around 351 and it continues to sell off all the way below 300 so that's a really good trade - almost like a 20% opportunity there and that's it those are about six examples that I just gave you of a bullish kicker three for a bullish kicker pattern and then three examples for a bearish kicker pattern and they make great trading opportunities they let you know especially if you see them in the indices that's very important because if you see in the S&P 500 towards the top of a rally that's probably a good sign to start booking some profits and in your profitable positions and maybe tighten up stops on others and and in the same thing if you are seeing the market in this huge meltdown and then you had this big panic so off and then the following day you gap above the previous day's opening price and then you see it start rallying thereafter that's a good sign that the bottom is probably in as well