

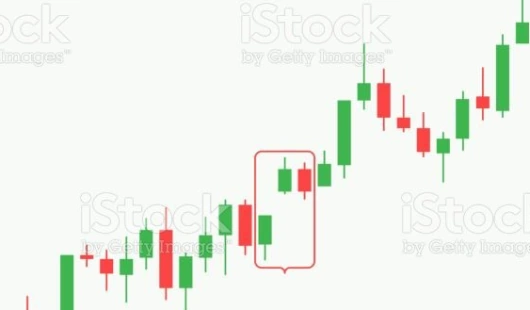
Bullish Side By Side White Lines
The pattern has three white candles that are supposed to be a bullish continuation pattern.
Theoretical performance: Bullish continuation
Tested performance: Bullish continuation 66% of the time
The pattern is characterized by a price gap appearing between the first line and two subsequent lines, which low prices are located above the first line high price. Two last candles should have a similar size. Also, their opening and closing prices should be similar.
Construction:
First candle: a candle in an uptrend with white body
Second candle: white body with the low price above the prior high price
Third candle
white body, the low price above the first line high price, the candle's size similar to the prior candle's size
In this tutorial about bullish side-by-side white lines candlestick patterns this video focuses on a daily chart where in each candlestick details a single day's trading this is most important for online trading.
Let's start, bullish side by side white lines, the bullish side by side white lines candlestick is a complicated pattern judging from its frequency rank of 73 out of 103 candlestick types, where one is the most popular; the pattern has three white candles that are supposed to be a bullish continuation pattern and they are two if you can find them.
However, the post breakout trend ranks just mid list so do not expect any large moves after the breakout how to identify.
1. First two days are white days with enough gap between the first and second day.
2. 3rd day is a white day about the same size as the 2nd day opening at about the same price. Psychology the second and third days are a failed attempt to reverse the uptrend. The uptrend remains intact.