

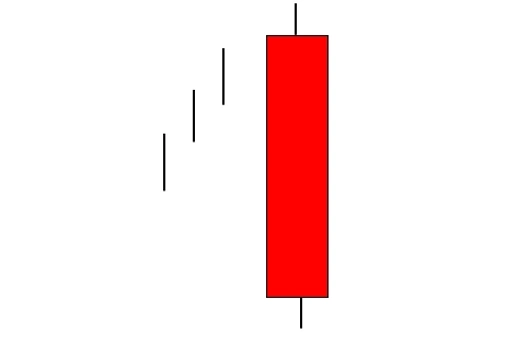
Bearish Long Black Candle
Bearish Long Black Candlestick reflects a strong selling pressure on the market and the share closes below the opening price.
Theoretical performance: Continuation 53% of the time
Trend: Neutral
Expected trend: Bearish
Reliability: Low
The candle’s black body is relatively long.
The length of the shadows is irrelevant.
Bearish Long Black Candlestick reflects a strong selling pressure on the market. The share closes below the opening price. The Long Black Candlestick typically appears in inclining trends. Investors are not recommended to act upon this candle, the previous candles must be analysed before decision-making.
Important factors:
Long Black Candlestick is a low-reliability formation which consists of one candle. It only reflects the trading of one day and it can signal both the continuation or the reversal of a trend. Therefore, it is recommended to interpret the formation with the previous candles and formations.
In this video we're looking at the long black candle as available from our candlestick pattern indicator for an inner trader eight, You'll find more information on that in the premium section over at lizardindicators.com. This is basically a bearish one bar reversal pattern that may indicate the reversal of a uptrend and so these three lines here signify the uptrend and the current bar is a down close and the candle body is x times larger than the average in the look back period and the lower shadow size of the candle does also not exceed a fraction threshold of the body size and so both of these conditions are user selectable you can define the x times above average condition as well as the lower shadow a fraction of the body size so by default we've set this to 0.25 for the lower shadow and the long black candle to be three times the average of the reference period.
So now we can have a look at the indicator dialog box and see how you can customize the pattern requirements, we see two long black candles plotting in a uptrend defined as a reversal pattern and you see the max body size is set to three times the average, the max lower shadow size is 0.25 factor of the body size itself and we see that both of these patterns have fairly small lower vix so that is in line with the definition here.
The reference period for this example is set to 250 bars and so these two patterns are three times the average found in the look back period. You can also set the long black candle to plot in downtrends so this one would probably qualify depending on the lower vic requirements here, let's mark it off and see what happens.
We see a long black candle plotting here and we now have it defined as a reversal as well as a continuation pattern i think for this example we will just stick with the original reversal condition and so one way of using this is of course to give you a heads up on a emerging short setup that might materialize itself there is a change in investor psychology during this uptrend negating what happened down here you can also of course use it as a exit condition for a existing long position, so let's say you took an entry on the rising three methods pattern.
This would give you a good indication that it's time to close out on that position so with that i'm going to conclude the video on the long black candle. If you have any questions for me feel free to reach out via the contact form over at listed indicators, otherwise send me an email at info at lizardindicators.com.