

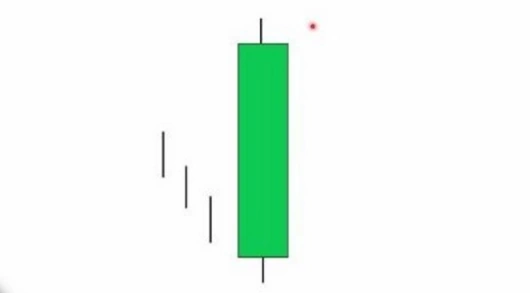
Bullish Long White Candle
Bullish Long White Candlestick reflects a strong buying pressure on the market where share closes above the opening price.
Theoretical performance: Continuation 58% of the time
Trend: Neutral
Expected trend: Bullish
Previous trend: Neutral
Reliability: Low
Long White Candlestick has a relatively longer body than other candles in the chart.
The length of the shadows is irrelevant.
Bullish Long White Candlestick reflects a strong buying pressure on the market. The share closes above the opening price. Bullish Long White Candlestick appears when there are aggressive buyers on the market. The candle usually forecasts an ascending trend, but its position on the chart can show its real message.
Long White Candlestick has a low reliability and consists of a single candle. It only reflects the trading of one day. The formation may signal the continuation of the trend.
Since the candle is a tall one, it only reaches the measure rule price target 60% of the time. That is when you take the height of the candle pattern and add it to the price of the top of the candle or subtract it from the bottom to get a target, depending on the breakout direction.
The long white candle as available from our candlestick pattern indicator for nineteen trader eight you'll find that in our premium section over at lizardindicators.com. This is a bullish one bar reversal pattern that could indicate the reversal of a downtrend so we have a downtrend here and this is a up close obviously, the candle body is x times larger than the average size in the reference period and the upper shadow of the candle is also quite small does not exceed a fraction of the body size and both of these variables that i mentioned are user selectable
The body size multiple of the average in the look back period as well as the fraction condition can be selected by the user. So, now we'll have a look at the indicator dialog box settings where you can customize the pattern and here we see two long white candles plotting after one another in fairly short order and if you go into the dialog box and access the pattern itself, we see the long white candle here.
The minimum ratio body size is three times the size of the average and the max upper shadow size is a factor of 0.25 of the body size and if we go up to the top of the indicator dialog box you'll find the reference period so the average of the look back period is defined as 250 so it's looking at the average size of the last 250 bars and the long white candle has to be three times that average to qualify as a pattern in addition to this upper shadow requirement that i mentioned and so we see here the end of a downtrend correctly predicted by the two long white candles so you can either prepare for a long setup in this scenario but you can also use it as a exit condition for a short signal for example the following three methods selected here you could use this as a exit condition for short positions as well.
Finally, You can select whether to display this pattern in up or down trends, the trend is itself is defined by a minor swing trend definition based on a deviation threshold and we're using the average true range and a 4.5 multiple of the atr period and so when that threshold is broken the trend will change and you can choose to display the long white candle in uptrends or in downtrends and so identifying it here as a reversal pattern we've set it to show up in downtrends.